
The basic laws of supply and demand determine the price action of any asset, including Bitcoin. When supply exceeds demand, the asset’s price tends to decline. Conversely, when demand outstrips supply, the price usually rises.
These same principles apply to cryptocurrencies, and on-chain metrics can provide valuable insights into Bitcoin holders’ behavior.
The Impact of Heightened Profit-Taking
When analyzing a Bitcoin bull market over the long term, the price movement typically exhibits significant upward volatility, mixed with periods of corrections and consolidation. Most investors know that financial markets do not consistently rise, leading to a dynamic interplay between supply and demand, resulting in periodic corrections.
This trend is evident when observing Bitcoin’s Realized Cap and Realized Profits.
- Realized Cap: This adds up the value of all BTC based on the price when they were last moved, giving a clearer picture of the money truly invested in Bitcoin.
- Realized Profits: This refers to the actual gains that BTC holders have made when they sell their Bitcoin for more than they paid.
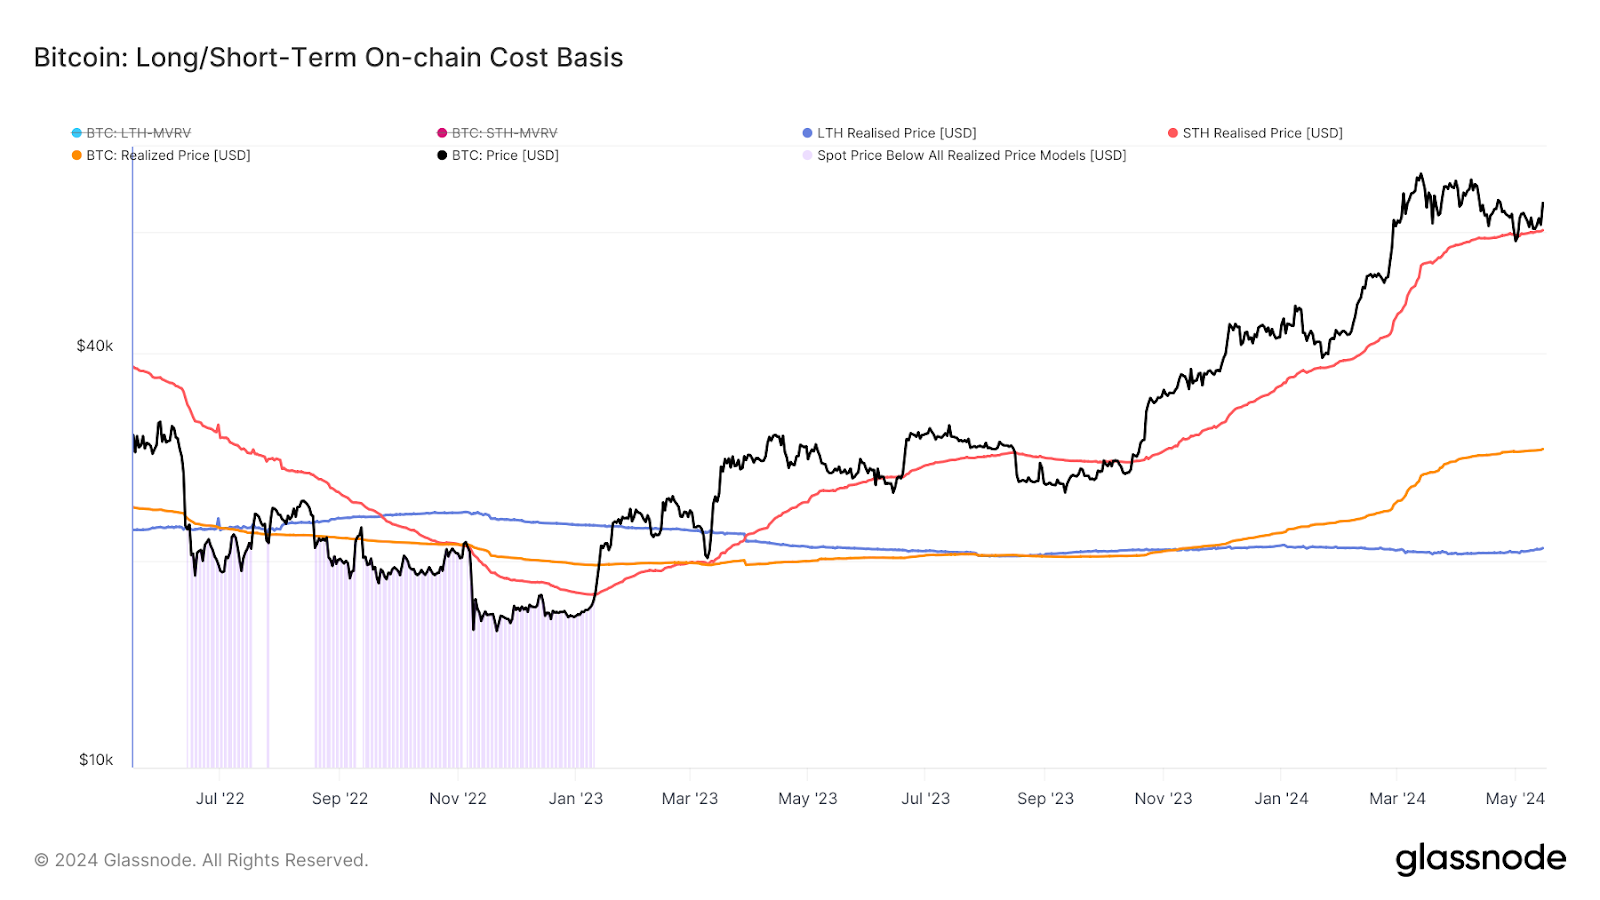
As Bitcoin reached a new all-time high of over $73,000 in mid-March, its Realized Cap also increased, suggesting that most long-term holders were profitable. Consequently, some exited their positions, resulting in a significant spike in Realized Profits.

The rising supply of BTC on the market surpassed the demand levels, leading to a corrective phase that saw the price of Bitcoin dip below $57,000. This drop brought Bitcoin below its Short-Term Holder Realized Price, creating a sense of fear in the market, given that short-term holders are more prone to sell based on price volatility.
- Realized Price: The average price at which all BTC were last bought. It is like finding out the average cost everyone paid for their BTC.
- Short-Term Holder Realized Price: The average price investors paid for BTC that they have moved around in the last 155 days. These BTC are the ones most likely to be spent or sold soon.
- Long-Term Holder Realized Price: The average price investors paid for BTC that they have not moved in over 155 days. These BTC are the least likely to be spent or sold soon.
The Short-Term Holder Realized Price, which currently stands at $60,500, served as an accumulation point despite investors’ fears. Indeed, long-term holders felt comfortable adding more BTC to their positions at this level after realizing profits in March.
Bitcoin Supply-Demand Trends Shift
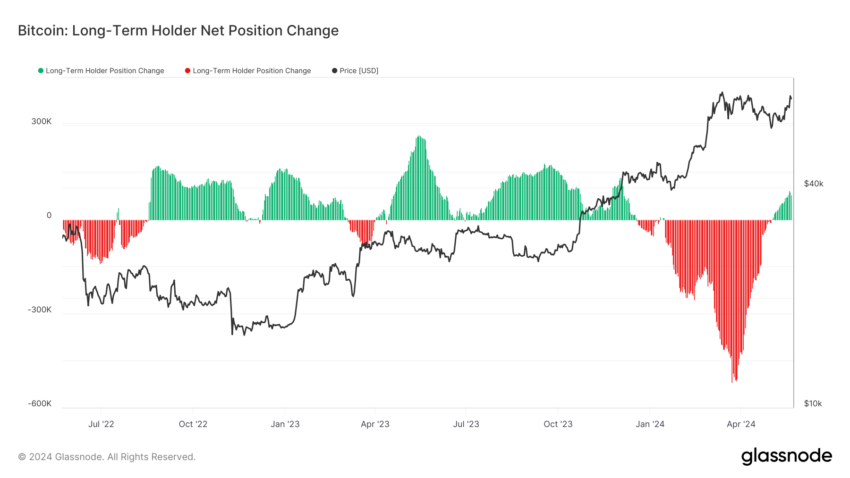
Bitcoin’s Long-Term Holder Net Position Change provides a glimpse into this behavior. After undergoing a prolonged distribution period, long-term holders have begun accumulating again, having amassed more than 70,000 BTC since early May.
- Long-Term Holder Net Position Change: It shows how the amount of Bitcoin held by long-term investors increases or decreases over time.
Based on the simple laws of supply and demand, as demand for Bitcoin begins to outstrip the available supply of BTC in the market, the odds of Bitcoin resuming its upward trajectory improve.
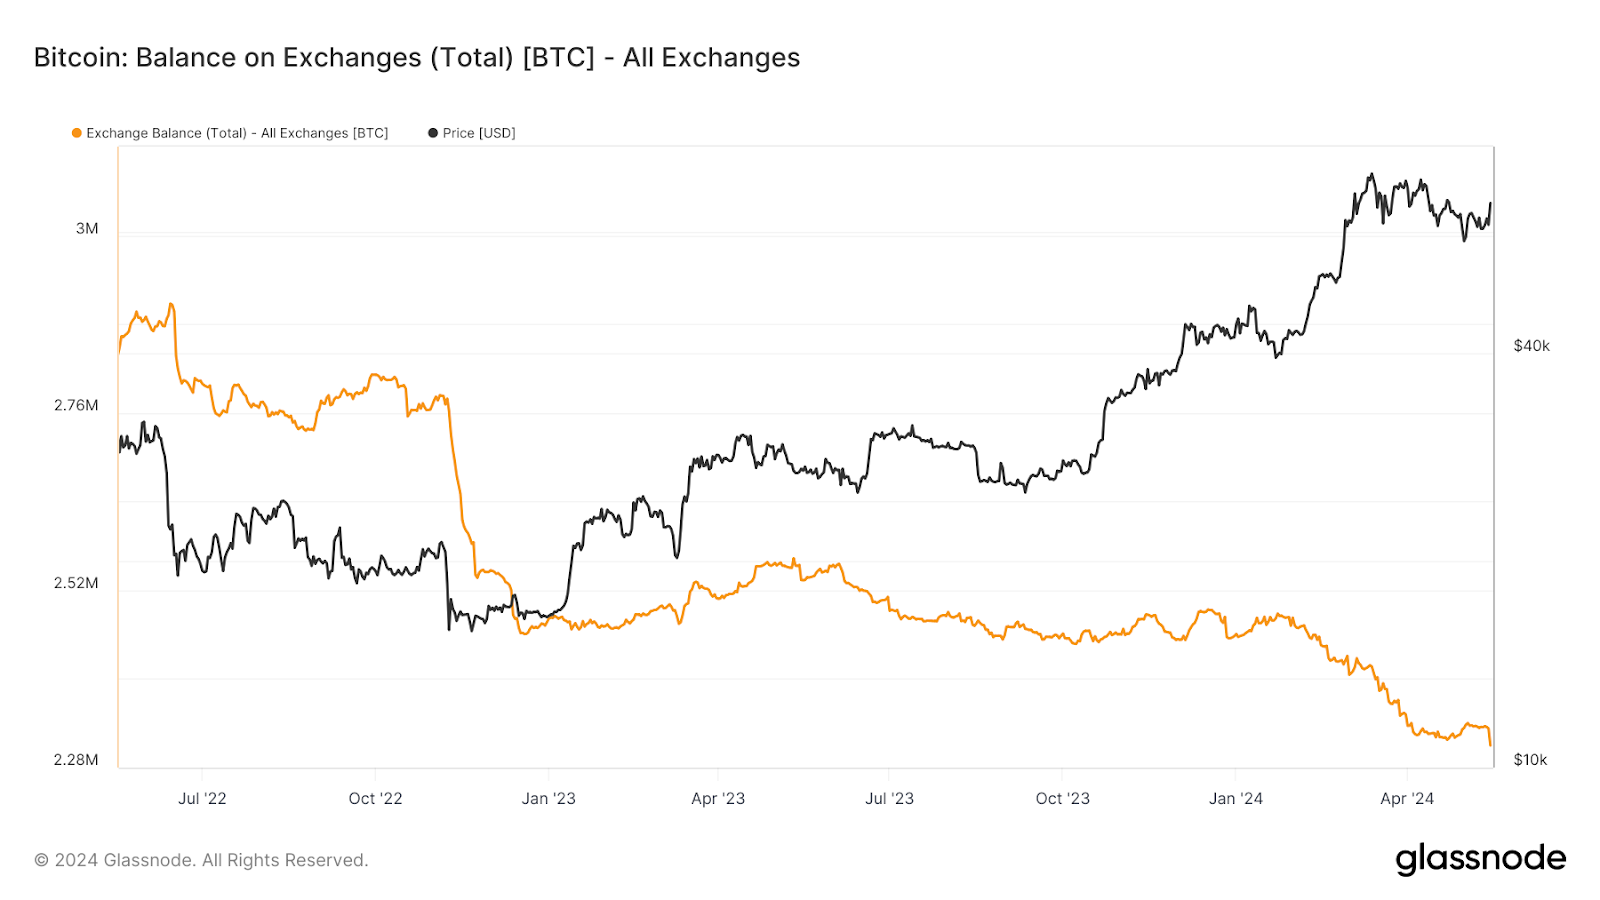
Observing Bitcoin’s Balance on Exchanges can corroborate these supply and demand dynamics.
- Balance on Exchanges: This refers to the total amount of Bitcoin held in cryptocurrency exchange wallets.
Since early May, more than 30,000 BTC have moved to private cryptocurrency wallets for long-term holding, showing confidence among holders in Bitcoin’s future value.
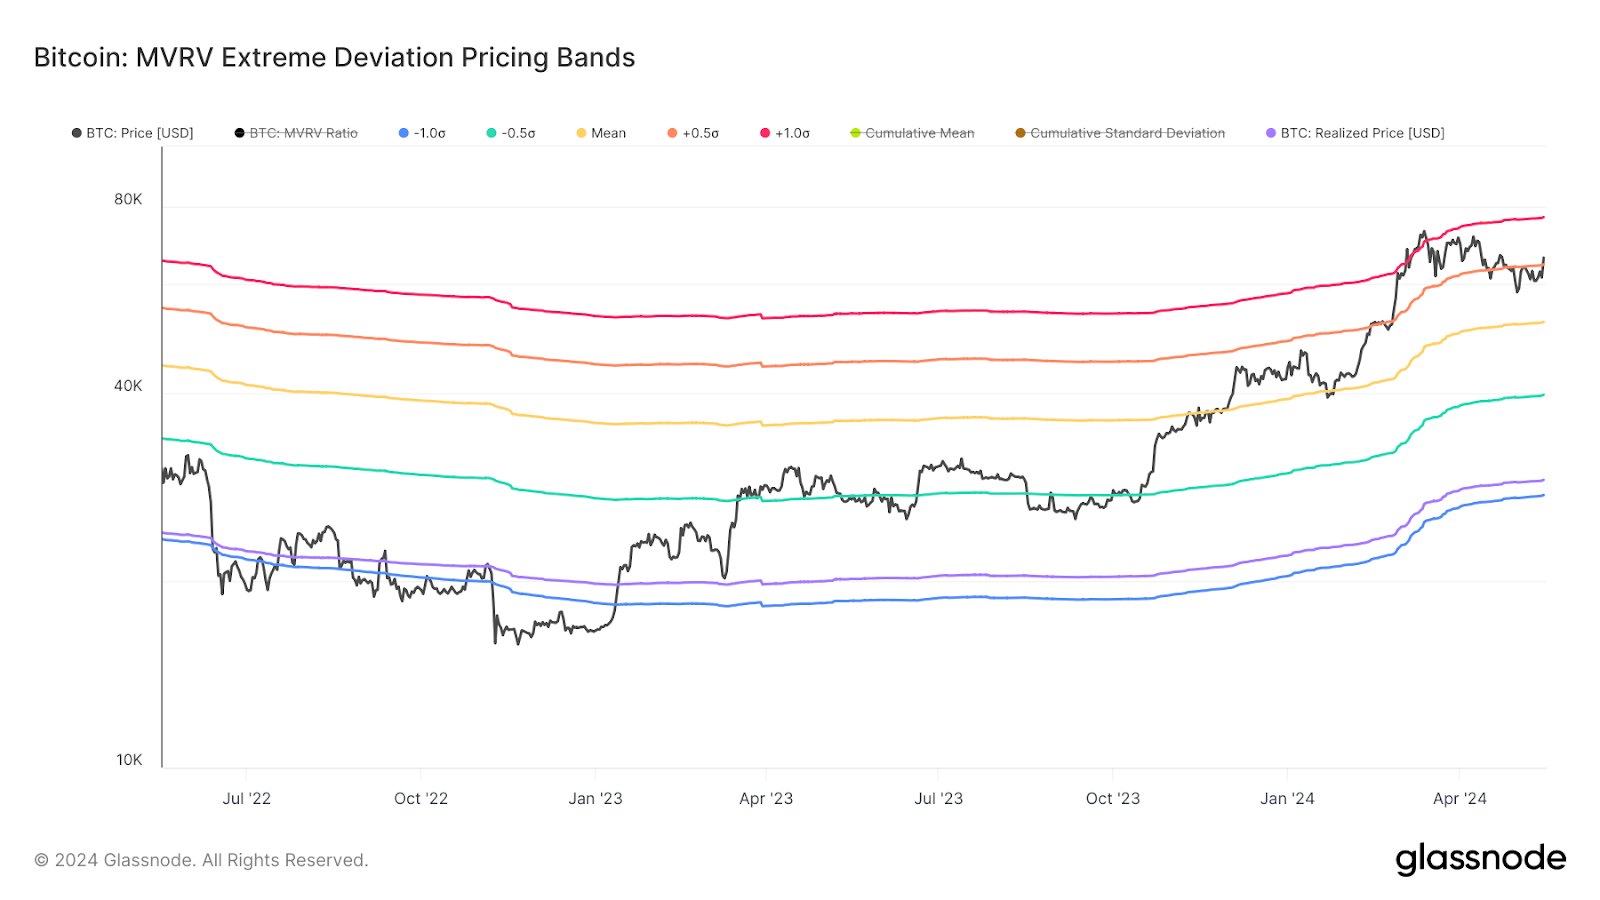
While assessing the future price action of any asset can be challenging, multiple on-chain metrics can hint at potential price points investors should pay attention to. One of these metrics is the MVRV Extreme Deviation Pricing Bands, which determines whether the price of Bitcoin is unusually high or low based on its historical averages.
- MVRV: It stands for Market Value to Realized Value. Market Value is the current price of Bitcoin times the number of BTC in circulation, while Realized Value is the average price at which all BTC were last bought.
- Pricing Bands: These bands show the upper and lower limits of Bitcoin’s price based on its historical MVRV values to help identify when Bitcoin is either extremely overvalued or undervalued based on historical price data.
Bitcoin recently moved back above the +0.5σ pricing band, which currently stands at $64,600. Historically, such an upswing has led Bitcoin to test the 1.0σ pricing band supported by rising demand. This pricing band is currently hovering around $77,000.
Read more: Bitcoin Price Prediction 2024/2025/2030
Summary and Conclusions
The basic laws of supply and demand dictate Bitcoin’s price movements. Indeed, prices fall when supply exceeds demand and rise when demand exceeds supply. On-chain metrics offer valuable insights into these dynamics, allowing analysts to understand Bitcoin holders’ behavior.
Recent data reveals a price decline below $57,000 as supply increased. However, long-term holders have demonstrated confidence by accumulating over 70,000 BTC since early May. This trend suggests resilience in the market despite short-term volatility.
Key metrics like Realized Cap and Realized Profits illustrate that many long-term holders were profitable at Bitcoin’s recent all-time high, leading to a wave of selling and subsequent price corrections. However, the accumulation by long-term holders at lower prices indicates a positive outlook for Bitcoin’s future value.
Read more: How To Buy Bitcoin (BTC) and Everything You Need To Know
Overall, these on-chain metrics help identify shifts in supply and demand, providing a framework to understand Bitcoin’s price action and investor behavior and indicating potential upward trends as demand begins to outstrip supply.
Trusted
Disclaimer
In line with the Trust Project guidelines, this price analysis article is for informational purposes only and should not be considered financial or investment advice. BeInCrypto is committed to accurate, unbiased reporting, but market conditions are subject to change without notice. Always conduct your own research and consult with a professional before making any financial decisions. Please note that our Terms and Conditions, Privacy Policy, and Disclaimers have been updated.