Most crypto traders use the RSI indicator to determine price movement and identify buy and sell signals. If you want to start trading cryptocurrency and learn how to spot the market’s price movements, you should learn about the part RSI plays in the technical analysis.
Here’s a quick guide on how to use the RSI indicator that will help you start navigating the world of crypto trading.
If you want to know more about trading, join BeInCrypto Trading Community on Telegram with like-minded people. Here you can share your experience, discuss and read all the hottest news on trading crypto, Web3 and the Metaverse. Join us
In this guide:
What is RSI?

RSI stands for Relative Strength Indicator and is one of the most popular indicators for cryptocurrency trading. The RSI indicator measures momentum, cryptocurrency price (it is based on the closing price), and price movement speed. This indicator will tell you when cryptocurrency assets are overbought or oversold.
The RSI indicator was introduced in 1978 by J. Welles Wilder Jr., who is considered the father of technical indicators for trading.
Traders use the RSI indicator to try and predict the future price of cryptocurrencies. While the indicator can be misleading at times, traders that understand how it works can get a pretty accurate idea of the future price movements. RSI is an important indicator for performing technical analysis.
Traders trust the RSI indicator to identify market signals and tell when the market is either bullish or bearish. The RSI is a line graph that oscillates between two extremes and can range from zero to 100.
The general consensus is that when the RSI is below 30%, the market is oversold, and when the RSI is above 70%, the market is overbought.
How to calculate RSI in crypto?
At the core of this RSI indicator stands a piece of essential information for cryptocurrency traders, which shows them the average upward price movement vs. average downward price changes over a default 14-period time frame. That means the RSI indicator measures the last 14 candles, but each trade can adjust the desired time frame, to suit the desired trading strategy. The timeframe can be displayed in weeks, days, hours, or minutes.
The formula for calculating the RSI indicator is:
RSI = 100 − [100/(1 + RS)]
Here, RS = Average Gain/Average Loss
Average Gain = Sum of gain per period/time frame
Average Loss = Sum of loss per period/time frame
However, traders shouldn’t worry about calculating the RSI formula. All trading platforms will provide the RSI values and display the RSI line graph on the market charts.
How to read the RSI indicator?
Usually, the RSI indicator has three lines. There are two straight-dotted lines. One at the top and another one at the bottom. There is a wavy line in the middle, which can sometimes cross over the other two lines, but it usually oscillates between the two.
The wavy line is the RSI indicator. Its value indicates if the trading assets are being overbought or oversold. The asset is oversold when the RSI indicator reaches a value of 30 or lower. When it crosses a value of 70 or more, the asset is oversold.
It is important to note that just because an asset is overbought or oversold, does not mean that the market will change. It simply means that things are moving faster than they should be.
The Relative Strength indicator can help determine market conditions and recognize price trends. If the RSI crosses the line at 50, it is a trend. If the RSI crosses over the 50, it indicates a positive trend, and it means that prices are rising (bullish market). The indicator falling below 50, signifies that prices are falling (bearish market).
Despite all the information provided by the RSI, traders have to use other indicators to generate buy and sell signals and ensure that the used trade signals are as accurate as possible.
RSI vs. MACD

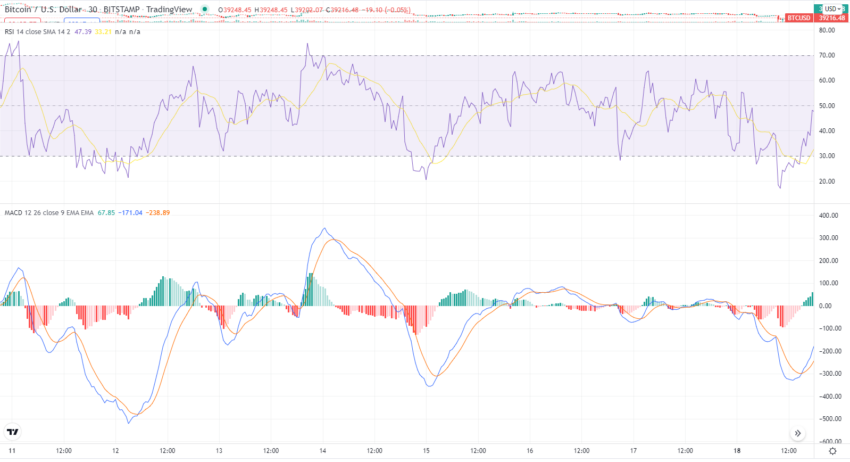
MACD, or Moving Average Convergence Divergence, represents another popular momentum indicator. It measures the strength of the asset’s price movement.
The MACD indicator measures the divergence of two Exponential Moving Averages (EMAs) – usually a 12-period EMA and a 26-period EMA. The MACD line is the result of their difference. A nine-period EMA line, referred to as the signal line, is shown over the MACD line. Many traders use it to identify short-term buy and sell signals.
When the MACD crosses above the signal line, it’s a buy signal. When the MACD line crosses below the nine-period EMA signal line, it is interpreted as a sell signal.
The RSI indicator gives traders an idea of the recent price changes, while the MACD is a correlation between the two EMAs. Many traders use the two indicators together to try to forecast future price movements and identify trade signals.
While the RSI and MACD are both momentum indicators, they measure different elements, and that can lead to contradictory signals. If the RSI has a value above 70 for an extended period, it may indicate that the market is overbought. This may lead traders to believe that a price correction might occur. But at the same time, the MACD indicator could still suggest that the prices could reach higher highs.
People often use the two indicators together because they complement each other. While the MACD uses exponential moving averages, the RSI illustrates a graph of recent lows and highs. Identifying a trending market is much easier using the MACD indicator, and the RSI reveals trend reversals by illustrating the overbought and oversold price levels.
What is RSI Divergence?

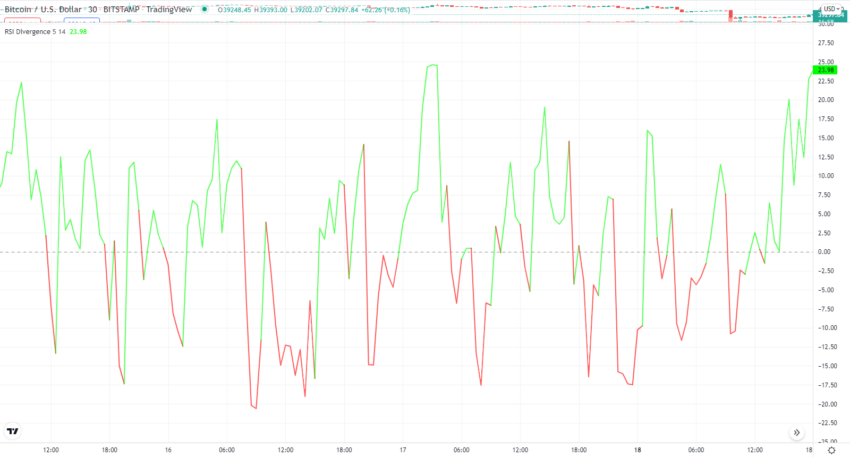
An RSI divergence occurs when a crypto asset’s price reaches a new high or low, but the RSI doesn’t reach a corresponding value. Effectively, the price graph and the indicator move in opposite directions. The RSI divergence can be:
- A bearish divergence: This happens when the RSI indicator does not confirm the new high, and this signals a weakening momentum.
- A bullish divergence: In this case, the asset’s price reaches a new bottom, but the RSI indicator doesn’t confirm it. Traders interpret this as a buy signal.
A divergence between the price movement of an asset and the RSI oscillator could indicate a reversal of trends.
Convergence and divergence of price and RSI
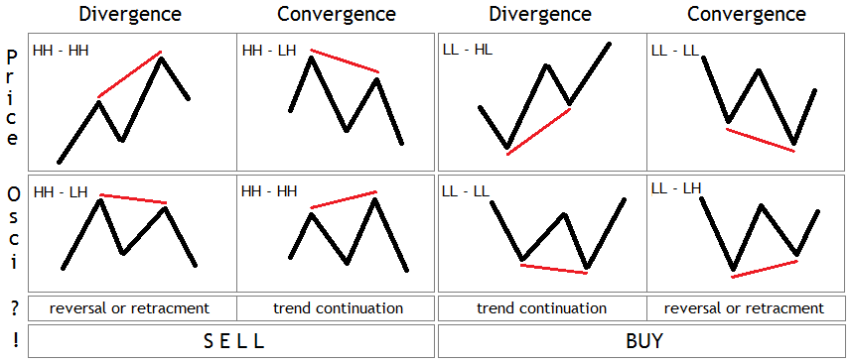
The two most important trading signals given by the RSI indicator are the convergence and divergence trends. Traders use these signals to spot price trends and forecast when the market is about to change its trend.
The convergence phenomenon happens when the price and the technical indicator move in the same direction. To determine a convergence structure, the price graph requires a moving average or RSI that moves in the same direction.
The divergence phenomenon is the exact opposite, and it occurs when the price graph and the technical indicator move in opposite directions.
In the case of the Relative Strength Index, an RSI divergence occurs when the price rises and forms higher highs. At the same time, RSI falls and forms lower highs.
This pattern frequently appears at the top of bull markets (uptrends) and is a strong reversal. Usually, the price changes its direction and falls when RSI divergence occurs.
Traders should be aware of the price levels that can give these trends:
- higher high (HH)
- higher low (HL)
- lower high (LH)
- lower low (LL)

The RSI divergence pattern is usually seen in several candlesticks before an uptrend changes direction or breaks below its support line. RSI divergence, which is also a leading indicator that the price support will soon be broken, is also a signal that the uptrend is likely to reverse.
A trader may recognize a bearish divergence if the asset’s value reaches a higher level and the RSI oscillator reaches a lower level. In the opposite situation, a bullish divergence is possible.
Failure swings
Failure swings are signals for trend reversal. The failure swings happen when the index oscillator does not follow the high point of an uptrend or the low point in a downtrend. The two possible failure swings are:
- Failure swing top: It occurs when the price reaches a high point, but the RSI indicator drops below the recent swing low (the most recent fail point). This is a signal to sell.
- Failure swing bottom: This occurs when the price hits a low point, but the RSI indicator goes above the most recent swing high. This is a signal to buy.
How to read RSI?
The value of the RSI indicator ranges from 0 to 100. When the RSI indicator is balanced when sits at around 50, it is balanced. When the value drops under 30, the market is considered oversold, while anything over 70 is considered overbought.
Cryptocurrency traders are looking for these indicators to determine if the buying or selling pressure has reached a breaking point. For instance, if the RSI indicator has a value of 75 and the asset has seen a considerable price increase over the past weeks, investors should expect a price pullback.
What is a bad RSI number?
Traders use the RSI indicator with other indicators to make sure they identify the market’s trend and signals correctly. Usually, traders create their own system around the RSI indicator.
However, generally speaking, traders should avoid selling when the RSI indicator drops below 40. That would be considered panic-selling. When the RSI indicator rises above 70, is when the FOMO (Fear Of Missing Out) sets in, and traders should refrain from buying — that would be the peak of a bull run.
How to use the RSI indicator in crypto trading?

Oftentimes, cryptocurrency traders use the RSI indicator as part of their crypto trading strategy. To open a trading position, the indicator must signal a trend change. Traders can use it for going long or short, depending on the type of account they already have for trading cryptocurrency assets.
Nowadays, centralized cryptocurrency exchanges offer users the option to speculate on the price movement of cryptocurrency. Before entering the market, traders should be aware that cryptocurrency assets are highly volatile assets, and even technical indicators can signal false trends.
To use the RSI indicator in crypto trading, you have to first enable the indicator. Most trading platforms offer the RSI indicator for all their price charts. Simply search for “RSI” in the list of technical indicators.
Look for price trends
If the RSI indicator is above 50, you should wait for an upward price movement, to confirm the positive trend and look for long trade opportunities. However, if the RSI is below 50, you will have to wait for a price decrease to confirm the weak trend and then look for opportunities to open a short position.
We often see the RSI line acting as a support or resistance area in either a downward or upward trend. Once reclaimed, it will indicate that momentum has changed. It can either pick up again, or it may suddenly stop gaining momentum.
Here is the RSI 14 for the BTC/USDT chart:

Spot divergences
Using the RSI indicator in conjunction with the crypto asset’s price line can help you spot future price changes. This is a powerful indicator to spot market conditions, and it needs to be carefully used, as it may also be misleading — especially for new crypto traders.
Use the RSI indicator to time the market
The RSI indicator is a reliable momentum oscillator based on an asset’s closing price. It has been used by traders on the stock market and now for cryptocurrency trading for a long time.
There are many different interpretations for the RSI indicator. You should spend some time practicing how to read the RSI chart and interpret it together with other indicators, such as the Moving Average Convergence Divergence (MACD) indicator.
The RSI indicator can also help traders find signs of a bear market or a bull market and can also contribute to their specific strategy to find the correct buy and sell signals. Although most traders are looking for short-term trade opportunities, it’s important to know that the RSI indicator delivers the more reliable signals when used for a long-term trading strategy.
Traders should also be aware of the convergence and divergence of the RSI indicator. Spotting a bullish or bearish divergence can be a challenge, but it might be worth investing the time to recognize them.
< Previous In Series | Trading | Next In Series >
Frequently asked questions
What is a good RSI indicator?
What does RSI 14 mean?
Is RSI a good indicator to buy?
How do you use the RSI indicator?
How do you use the RSI indicator effectively?
What is RSI buy signal?
Which indicator works best with RSI?
Trusted
Disclaimer
In line with the Trust Project guidelines, the educational content on this website is offered in good faith and for general information purposes only. BeInCrypto prioritizes providing high-quality information, taking the time to research and create informative content for readers. While partners may reward the company with commissions for placements in articles, these commissions do not influence the unbiased, honest, and helpful content creation process. Any action taken by the reader based on this information is strictly at their own risk. Please note that our Terms and Conditions, Privacy Policy, and Disclaimers have been updated.


