If you are a bitcoin-only trader or an investor, there’s a significant date to mark in your calendar. In April-May 2024, bitcoin halving will further reduce BTC’s inflation rate. And as Bitcoin halving is a supply-reducing event, a price increase is often expected at bitcoin’s and even altcoins’ counter. So which bitcoin halving investment strategies should you employ? What do you need to know before the big date?
The strategies listed in this piece consider specific bitcoin indicators and project upcoming price movements per historical data, market expectations, and other parameters. We demonstrate how to tie indicators like bitcoin dominance, cryptocurrency exchange flows, Bitcoin S2F, and more with previous halving scenarios and historical price moves. This will give you a rough price-specific ballpark to aim at in relation to BTC’s price over 2023 and 2024.
Top Crypto Trading Exchanges
Best for interest rates
Best for spot trading
Best for altcoins trading
- How to prepare for Bitcoin Halving?
- Bitcoin halving: a quick refresher
- Key Bitcoin indicators and the related price actions
- Does bitcoin price go up after halving?
- How can long-term investors approach the halving cycle?
- What will happen after Bitcoin halving in 2024?
- Are Bitcoin halving trading and investment strategies fool-proof?
- Frequently asked questions
How to prepare for Bitcoin Halving?
The Bitcoin halving is approaching at a clip. As a new or seasoned trader, you might want to get all the technical and fundamental elements in to prepare better. However, the first and foremost strategy to prepare would be to buy some Bitcoin (BTC) in the first place. Here is a handy Bitcoin Halving countdown tool to help you track the timeline of your purchases. Use this countdown knowing that the price of BTC might be a tad volatile closer to the halving day, both pre-and-post.
You can start tracking the lows and placing manual buy orders to acquire BTC. Or, you can rely on dollar-cost-averaging (DCA) to keep accumulating Bitcoin, anticipating the surge. But why buy now, you ask?
With the halving expected to reduce the supply, the demand might increase. That’s the rationale behind the “Buy and HODL BTC” strategy. While many exchanges and platforms exist to buy and hold BTC, you might want to consider centralized exchanges (CEXs) for a seamless experience. And if you are willing to go the CEX way, Coinbase might just be the right option for you.
Coinbase lets you access multiple BTC pairs, BTC/USD, BTC/USDT, and more, each with high liquidity. This promises quick order fulfilment. Plus, robust security measures, like 2FA, email verification, and more, are in play — each protecting your BTC holdings.
And once you acquire BTC, the trick to prepare for halving is to keep holding it for at least one year post the event. But wait, if you are still unsure as to what halving actually means in terms of supply and demand, read through the next section in detail.
Bitcoin halving: a quick refresher
Bitcoin halving is a pre-defined event that’s embedded within the Bitcoin network’s protocol. It is automatically initiated and happens once 210,000 blocks are added to the network. The halving cycle aims to control the issuance and slow down the inflation rate all the way to its final mark of 21 million bitcoins (BTC). This is one of the reasons that Bitcoin is seen as a better option than standard fiat currency or other forms of government-backed digital assets.
If you are looking for specifics, the 2024 Bitcoin halving will reduce the block reward allocation from 6.25 BTC to 3.75 BTC. And this will make miners more reliant on transaction fees instead of rewards. For bitcoin, halving is a pre-defined mechanism that initiates automatically, making this one of the most innovative implementations of blockchain technologies.
Halving timeline and other insights
While the 2024 halving cycle is on the cards, three other instances of Bitcoin halving have already graced the network with the dates as follows:
First halving: November 28, 2012
Second halving: July 9, 2016
3rd halving: May 11, 2020
While the immediate effects of halving are experienced by the miners, traders and investors are often the secondary benefactors of this event. Notably, the price of BTC moves up, close to and after every halving cycle. And that is exactly why you should have Bitcoin halving investment strategies in place to help use the price moves for both buying and selling.
Bitcoin halving hinges on scarcity, so investment strategies should be considered in cohesion with other indicators. And the choice of indicators should involve those that can establish relationships between supply, scarcity, network growth, on-chain metrics, and, obviously, the price.
Key Bitcoin indicators and the related price actions
Looking at the price action of BTC around halving events makes sense. However, pairing them with a handful of Bitcoin-specific indicators can present a picture of the entire market. By adding indicators to the analysis, we can understand the logic behind the price increase and volatility in relation to Bitcoin supply, social sentiments, the state of miners, the reaction of investors trading BTC derivatives, and more.
So let us get started with checking the indicators:
Stock-to-flow
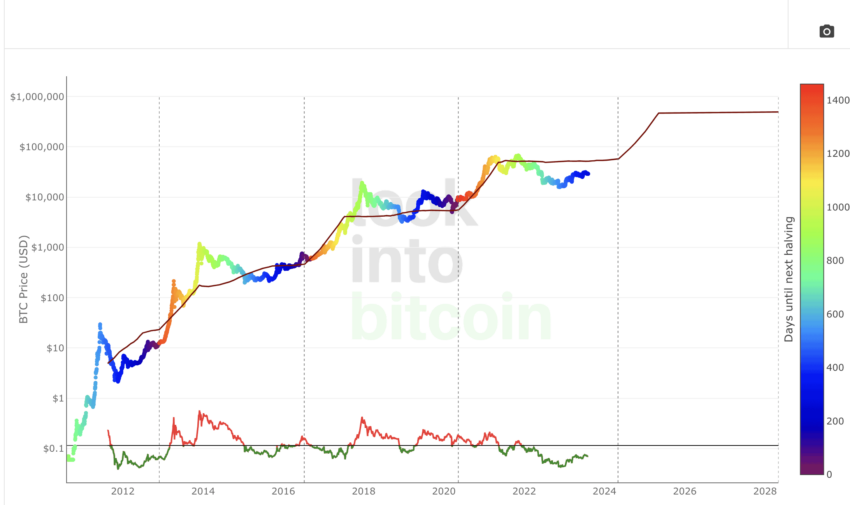
Here is a popular pricing indicator that also ties the pricing with BTC’s scarcity. The stock-to-flow analysis is done by dividing the stock of the asset — the existing supply — by the new and annually produced supply. The chart comprises a thin line signifying the model or the fair price of the asset and a colored line following the same and varying at times to show deviation.
Reaction to halving
Bitcoin halving directly impacts the new BTC supply by cutting miner rewards in half. Therefore, we can expect a surge in the Stock-to-Flow metric, with the annually evaluated new supply getting a hit. Do note that the total supply of BTC doesn’t change. It still remains 21 million bitcoins (BTC). However, halving reduces the annual supply or the number of bitcoins (BTC) entering the system each year, lowering the issuance rate and enhancing scarcity.
The logic behind using it
The logic behind using it is the fact that S2F directly correlates with the price of BTC. This means that while charting, the S2F indicator also has a price-related section, which historically has surged following the halving events. As having amplifies scarcity, the fair or the model price line surges, usually taking the actual price along with it.
Redefining scarcity, one tweet at a time!
Signals investors should look at
Investors planning to go long in Bitcoin should track the S2F before and after the halving. A good ideal entry point could be model price line surges post-halving, and its variance with the actual price reduces. Do note that a variance or deflection on the upside is desirable, as who wouldn’t want the actual price to beat the model price?
Therefore, if you are an investor willing to wait till halving, you might consider an entry when post the halving cycle, the fair price and the actual price lines touch each other, with the actual price moving up from the downside. You would then be betting on the actual price line to cross above the model price line.
Hash rate
Bitcoin’s hash rate is also considered the total computational juice dedicated to miners. The higher the hash rate, the more secure the Bitcoin network is.
Reaction to halving
If you plan on following the hash rate indicator close to halving, both before and after, you will know that the event is intended to reduce block rewards after every 210,000 blocks. And reduced rewards can hit miner profitability, lowering the hash rate in the process.
The logic behind using it
Miners who rely on block rewards might sell their setups or sell their BTC in their Bitcoin wallet. Therefore, post-halving, not just the hash rate but also the price of BTC might drop. And reduced prices can impact other miners as the existing block reward would then amount to less. This can lead to a short-term downward spiral.

Signals investors should look at
As a trader, you can track the hash rate to look for short positions. If the hash rate nosedives immediately after halving, the prices might experience volatility, which can be a good time to short BTC. However, if you wish to go long, it is better to wait for Bitcoin’s built-in difficulty adjustment protocol to kick in and the hash rate to stabilize. Once that happens, you can fit in the S2F model and enter at the time time.
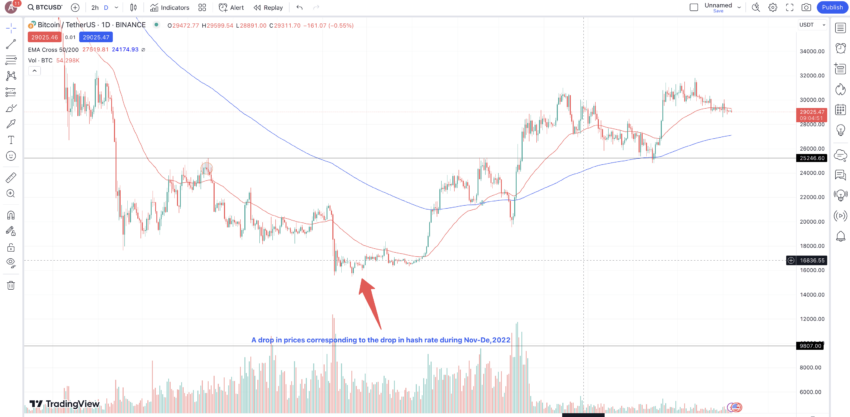
A decrease in hash rate can also boost the prices. It might bring more miners into the mix, which can add to network security. Plus, it can slow down, block production, and cause scarcity. And also, if miners move out of the ecosystem, there can be a supply shock that would introduce scarcity.
Did you know? The 2021 mining ban by China caused the bitcoin hash rate to drop significantly. In 2023, the network hash rate is now more than double that of the pre-ban highs.
Active addresses
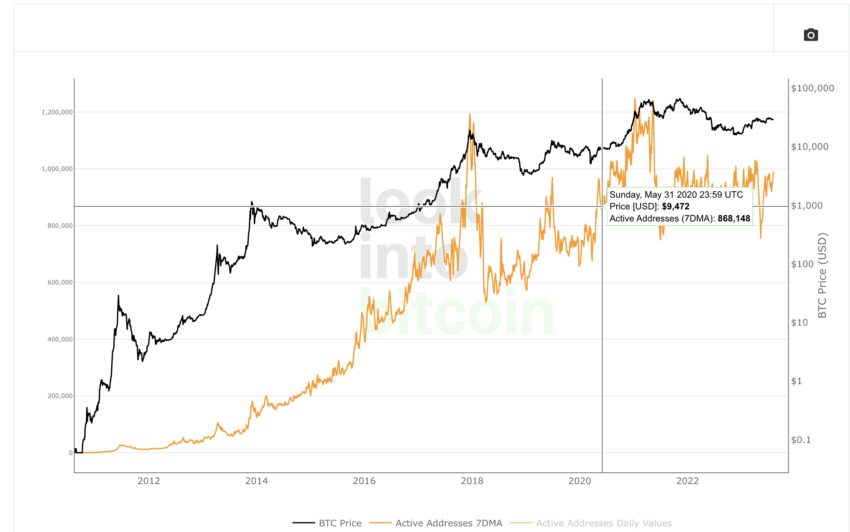
This metric defines the number of unique addresses transacting on the bitcoin network within a given period. This indicator allows you to track user engagement and also network activity.
Reaction to halving
Halving is an anticipatory event. Also, historically active addresses have shown a surge in value around events like these. However, these could be people creating new bitcoin wallet addresses and holding bitcoin at those addresses before halving.
The logic behind using it
The logic is that active addresses or individuals transaction on the Bitcoin network might increase, either for selling, buying, or simply moving BTC before halving. Therefore, when paired with market sentiments, technical analysis tools, and even volume indicators, you can use active addresses to predict the right entry points.
Signals investors should look at
Tracking active addresses in regards to halving is relatively simple. You can check for spikes or drops close to the halving cycle— 6 months on either side — and check if the trading volume validates the same or not. Also, if the user sentiments, checked via tools like the LunarCrush, indicate positivity, you might consider entering.
Bitcoin Days Destroyed (BDD)
Here is an indicator that identifies the movement of BTC that has been held long. This can be a reliable tool as it picks the investors’ minds and can track their behavior. As for the formula, BDD values are the product of the BTCs that are involved in a particular transaction and the number of days since those BTCs moved.
Reaction to halving
BDD can track investor sentiments. If the BDD metric changes, it means that long-term investors or even BTC HODLers are moving their coins, pre or post-the halving event.

The logic behind using it
If BDD surges, there might be an increase in the interest and market activity concerning Bitcoin. Also, in May 2023, Bitcoin volume dropped significantly, indicating a low BDD value. This might also mean people aren’t trading or moving a lot of BTC but sitting on it.
Signals investors should look at
At first glance, an increase in the BDD value indicates profit booking. Once that is encountered pre or post-halving, one of the better bitcoin halving investment strategies would be to look at the transfer volume to see if people are moving their BTC. And if that holds as well, you can look at the specifics by checking for whale and smart money movements using a Bitcoin explorer like Blockchain.com or Blockchair.
Once you can identify whale BTC wallet(s), you can even track the bitcoin exchange flows to track the state of BDD.
Bitcoin rainbow chart
The rainbow chart is a valuation tool for BTC, charted as the logarithmic curve. The chart comprises rainbow-like colored bands showcasing market sentiments and the corresponding price moves.
Reaction to halving
Even without considering halving, the rainbow chart boasts zones that can tell how investors view BTC at any given time. For instance, the lowest band corresponds to a “Fire Sale,” meaning that BTC is oversold and accumulated at the counter. The chart highlights buy-sell zones according to BTC’s price pattern.
The logic behind using it
The logic behind using the rainbow chart is simple. Smart investors prefer accumulating BTC at certain points, pre and post-halving. If you can identify such zones, it becomes easier to locate entry points.
Signals investors should look at
If you look at the historical patterns associated with the rainbow chart, you will notice that 6 to 12 months prior to the halving events, BTC accumulation usually starts. These trends can be used to predict the next phase of entries. It is worth noting that at this time — August 2023 — BTC is in the “Fire Sale” zone — a finding that aligns with the halving cycle that is due in under nine months from the time of writing.
Similarly, if you notice the trends, the price starts shifting colors — from the buy and accumulate areas to the overbought territory. 6 to 12 months post-halving. Therefore, as a trader, you might identify the right exit points or potential shorting opportunities.
Fear and greed index
This is purely a sentiment indicator measuring the market prevailing emotions of investors in the cryptocurrency market. Its value ranges anywhere between 0 to 100.
Reaction to halving
Anticipatory events like the halving are expected to make investors and traders greedy. You can then see the index moving in the “Greed” zone. Also, if halving occurs in the wake of a bear cycle, as an investor, you might even get the opportunity to enter BTC at oversold and high “Fear” zones.
The logic behind using it
Anything between 0 to 30 indicates fear and even uncertainty. And values ranging from 60 to 100 indicate optimism. Notably, the greed is expected to increase to its peak 6 to 12 months post-halving, as during that phase, most accumulation occurs. However, post the “Greed” peak, investors should be wary of corrections.
Signals investors should look at
If you are looking for reliable and quick-to-understand bitcoin halving investment strategies, check for the most “Fearful” zones 6 to 12 months prior to halving. This might be a good time to enter. Buying in the neutral zone of 40-50 can also be an option, provided you use active addresses, rainbow charts, and other indicators to confirm.
To exit, look for post-halving greed levels, values in excess of 70.
Miner charts
Miners form the core of the Bitcoin network. Also, positivity regarding miner-specific charts indicates that miners aren’t feeling the heat and pushing their holdings out to exchanges for selling. Miner revenue, miner capitulation, and Hash Ribbons are some of the indicators you should focus on.
Reaction to halving
Miner revenue usually drops immediately post-halving, which also takes the price down with it, as to compensate for the drop in revenue, miners usually sell off their holdings.
The logic behind using it
The logic behind using these charts is simple. Hash ribbons are based on the hash rate and help identify potential reversals in regard to the hash rate. When it comes to reading the hash ribbon chart, you need to see the relationship between the 30-day simple moving average and the 60-day simple moving average of Bitcoin’s hash rate.
The shorter-term MA crossing above the longer-term MA shows the end of miner capitulation and stabilizing of the hash rate. This is determined as a green dot. If the 10-day SMA and 20-day SMA crossover happens during this phase, you get a buy signal, represented by a blue dot.
Signals investors should look at
As an investor, you should wait for an increase in miner revenue post-halving to enter. As for hash ribbons, the prerequisite would be for the miner’s capitulation to end. Once that happens, you can apply technical analysis to locate the best time for buying bitcoin.
As Bitcoin’s hash rate continues its unrelenting climb into new highs, Hash Ribbon’s doubters are getting absolutely destroyed.
Charles Edwards, founder of Capriole Fund: Twitter
Bitcoin dominance
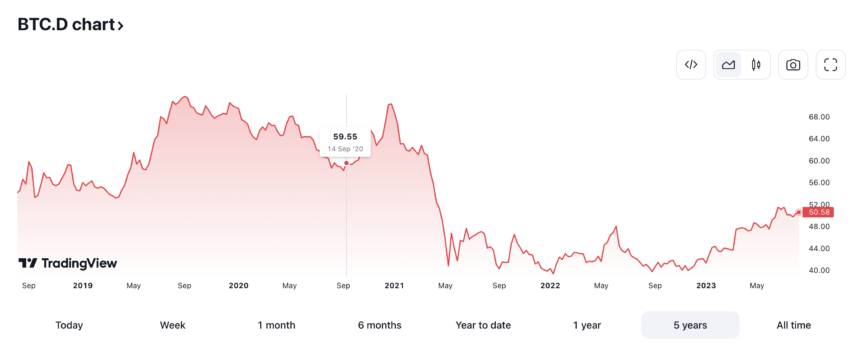
This indicator reveals Bitcoin’s market cap in relation to the total market cap. Despite the indicator primarily responsible for determining the influence of bitcoin in the crypto world, it might help you identify the investing potential across altcoins.
Reaction to halving
Historically, bitcoin dominance has picked up pre and post-halving, with investors flocking to it in anticipation of a price rise.
The logic behind using it
It is worth noting that there are many ways of interpreting bitcoin’s dominance. When the dominance increases in a bull market, whilst the price of BTC increases, it is better to prefer BTC over altcoins. However, if, despite BTC’s price rise, the dominance decreases, you might turn towards altcoins, showing higher risk tolerance among investors.
Signals investors should look at
If you plan on trading around bitcoin halving using the bitcoin dominance indicator, look for surges or drops six to 12 months before and after halving. If Bitcoin dominance surges, it might indicate accumulation, which could lead to a price rise.
These are only a handful of indicators. You can use tools and on-chain analytics like transaction volume and/or the likes of bitcoin volatility, futures and options markets’ sentiments, and golden ratio multiplier to go deeper into deciphering bitcoin halving trading strategies.
Does bitcoin price go up after halving?
Yes, the price of Bitcoin has actually moved up every time post-halving. However, the price increase isn’t only a post-halving event. As buying and selling of BTC continues even before the effects of halving set in, there have been instances of price rises months before the block rewards are cut in half. Let us now look at each halving cycle from a historical perspective. Here’s how the prices have moved previously:
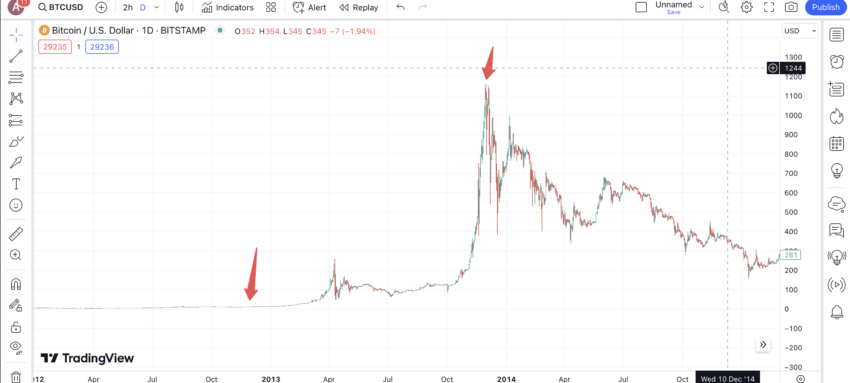
First halving cycle: November 28, 2012
Pre-halving: Prices held relatively stable throughout the entire pre-halving phase. (No timeframe data).
Post-halving: Within one year, BTC moved from $12 (approximately) to over $1150, validating the expectations around price surges. The timeframe of reference is 12 months.
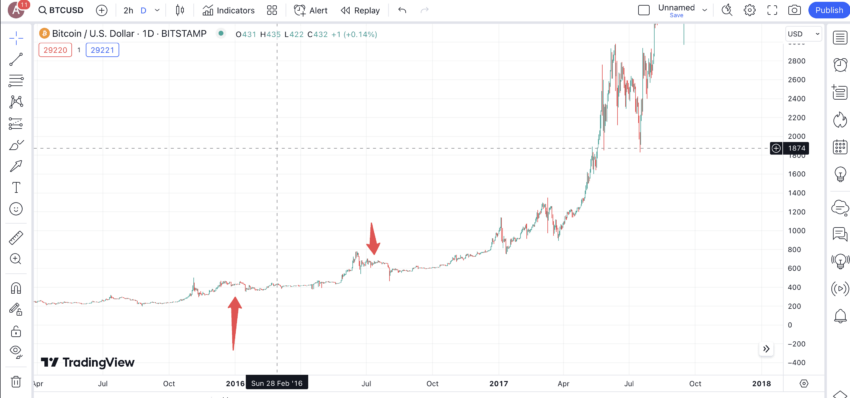
Second halving cycle: July 9, 2016
Pre-halving: At the start of 2016, BTC was trading at $420 (approximately). The build-up to the halving event in July pushed the prices to almost $680 (approximately). The timeframe of reference is six months.
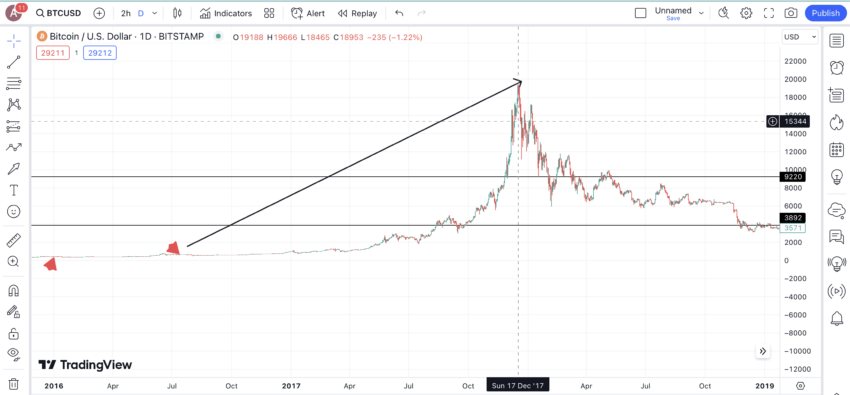
Post-halving: However, over the next 18 months, BTC experienced a massive bull run of sorts, which pushed the prices to almost $20,000 by December 2017. The timeframe of reference is 18 months.
Third halving cycle: May 11, 2020
Pre-halving: As the pandemic surfaced, the price of BTC went under $4000 by March 2020. However, by May 11, 2020, it was over $10,000 in anticipation of a halving-led relief run. The timeframe of reference is two months.
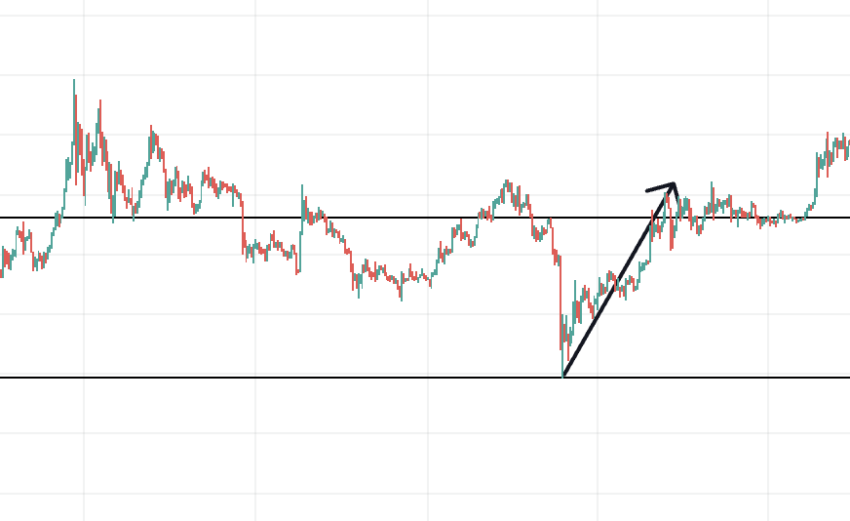
Post-halving: Over the next 11 months — by April 2023 — BTC surged up to $65,000, showing that even the post-pandemic effects couldn’t keep BTC down. Timeframe of reference is 11 months.
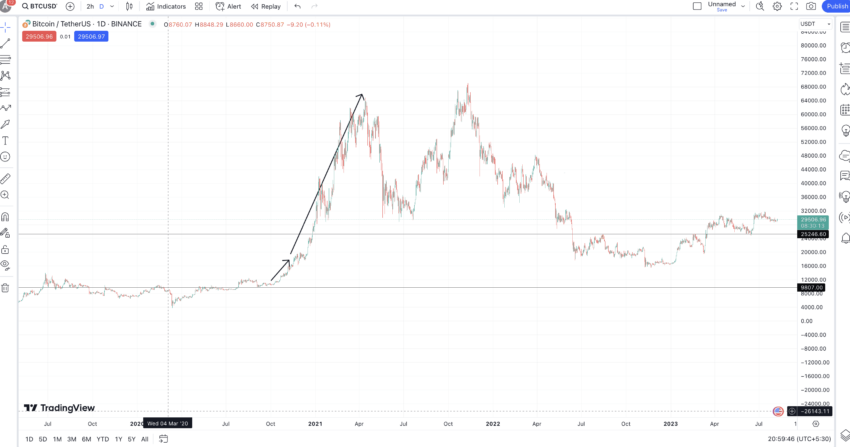
Keeping all the historical patterns in mind, the best timeframe for bitcoin halving trading strategies would be entering six months before the event and holding it till 11 to 18 months post-halving. Do note that individual risk tolerance, market sentiments, and even macroeconomic factors would also determine how early and how late you enter and exit, respectively.
This inference aligns with PlanB’s — creator of the Stock-to-Flow model — go-to investment strategy for bitcoin halving. Here is the tweet that captures the same:
How can long-term investors approach the halving cycle?
Even though these might sound generic, here are the bitcoin halving investment strategies or rather approaches that long-term investors can consider following:
- Start by studying historical trends and patterns. You can refer to our earlier analysis and plan investment strategies accordingly.
- Monitor key price trends in correlation with market sentiments, especially pre-halving. The idea here is to find the right entry point. For instance, if someone tracked the hash ribbons-powered buy signals to locate the macro lows, the one close to $16,000 for BTC towards the end of 2022 could have been identified. Yet, that didn’t flash a buy signal immediately as the indicator waited for the price to stabilize.
- During halving, you should refrain from panic buying, FOMO, or even panic selling.
- Keep track of altcoins to diversify bitcoin halving investment strategies by looking at Bitcoin dominance, coin-specific technical indicators, and other factors. The idea here is to hedge losses and maximize the halving cycle.
- Focus on the long haul and stay patient post-halving. Despite that, you should keep reviewing the portfolio regularly.
- In case you do not want to go all in, dollar cost averaging six months prior and up to 18 months after halving, can still be a rewarding strategy.
- And finally, if you are into technical analysis and interested in timing the market for great deals, check out key indicators like the relative strength index (RSI), crucial chart pattern breakouts, and trading volume before taking the plunge. This strategy might also help if you plan on trading BTC in your bitcoin wallet instead of investing.
What will happen after Bitcoin halving in 2024?
Post bitcoin halving in 2024, the block reward will go down to 3.75 BTC per block. Here are the price-related, network, and macroeconomic possibilities that might surface:
- Price surges are led by an increase in holding trends. However, that could be a long-term happening.
- Reduction in inflation, which might start global adoption of BTC over fiat currency and other digital assets even in some fiat-specific regions.
- Institutional investors might start showing more interest in BTC as even ETH saw large institutional inflows post the Shapella upgrade, where the inflation rate decreased significantly.
- There might be a chance of an immediate drop in prices with disincentivized miners selling their BTCs and mining setups.
- As miners will need to focus more on transaction fees, transaction prioritizing might occur to attain a higher share.
- There might be some short-term market volatility, with some investors exiting and some trying to enter the post-halving scene. BTC can even move in a range immediately after experiencing the miner-led dip.
As mentioned, all three scenarios — price dip, sideways trading, and price increase — are possible. What happens when will depend on the indicators we discussed, technical analysis, market sentiments, and even the macroeconomic factors.
Are Bitcoin halving trading and investment strategies fool-proof?
No trading and investment strategy is fool-proof. That is exactly what the FTX contagion taught us. However, the bitcoin halving trading and investment strategies we mentioned in this article are diverse and should work well with each other to give you credible entry and exit points. Yet, before moving forward with these strategies, it is advisable to have a robust risk management plan in place based on your risk tolerance.
Frequently asked questions
Bitcoin halving events, which occur approximately every four years, halve the reward that miners receive for validating transactions and adding them to the blockchain. This reduction in rewards can decrease mining profitability, particularly for those with higher operational costs, potentially causing some miners to exit the market. The reduced rate at which new BTC is generated post-halving can lead to a perceived scarcity of supply, which historically has been bullish for Bitcoin’s price over the long term.
Bitcoin halving cycles are significant events that can influence long-term investment strategies in several ways. Historically, halving events have been followed by periods of substantial price increases, although past performance is not always indicative of future results. Long-term investors might view halving as an opportunity to accumulate more Bitcoin before potential price increases. However, investors need to consider the inherent volatility of cryptocurrency markets, the timing of their investment relative to the halving cycle, and their risk tolerance.
As per our analysis based on the historical price patterns and other indicators, bitcoin halving might be pretty rewarding for a standard investor. However, the best approach might be to buy BTC 6 months before halving and hold it for 18 months post-halving. However, investors should be patient and should not panic sell.
If you read through our piece on Bitcoin halving trading strategies, you would know that purchasing BTC 6 months prior to halving might be a good call. Historical price trends have revealed price moves of almost 50% to 200% months before halving. However, the final call should depend on your risk tolerance and broader market outlook.
Bitcoin halving is a code-specific process ingrained within the network’s code — one of the many perks of blockchain technologies. And as there are 21 million bitcoins (BTC) in existence, with each halving happening after every 210,000 blocks are mined, we can expect the halving cycle to last till 2140 — the year when the last BTC is supported to be mined.
Historical price trends post-halving reveal that the price of BTC has always moved anywhere between 11 to 18 months after the event. Despite the previous instance of price increase, future price moves are still speculative and depend on multiple factors like the state of indicators like bitcoin dominance, stock-to-flow, and even social sentiments identified via the Fear and Greed index. Plus, macroeconomic factors and other parameters are also in play and can determine whether the prices post-halving will increase.
Trusted
Disclaimer
In line with the Trust Project guidelines, the educational content on this website is offered in good faith and for general information purposes only. BeInCrypto prioritizes providing high-quality information, taking the time to research and create informative content for readers. While partners may reward the company with commissions for placements in articles, these commissions do not influence the unbiased, honest, and helpful content creation process. Any action taken by the reader based on this information is strictly at their own risk. Please note that our Terms and Conditions, Privacy Policy, and Disclaimers have been updated.

